First & solo product designer for 2016 H2 – 2019 H1
ThousandEyes’ Multi-Product UX Journey
As the first and solo product designer, I built the design foundations and experience strategy that carried a single-product startup into a four-product platform, through to Cisco’s ~$1B acquisition.
ROLE
First & solo product designer, later design team lead
SCOPE
Platform UX architecture across 4 product lines
PLATFORM
Enterprise SaaS, desktop web
TYPE
Full-time, in-house
01 - CONTEXT
One flagship product get scaled to four-product platform
ThousandEyes is a network intelligence platform, the “Google Maps for the Internet.” It shows where data gets delayed, dropped or throttled across global networks that users can’t see.
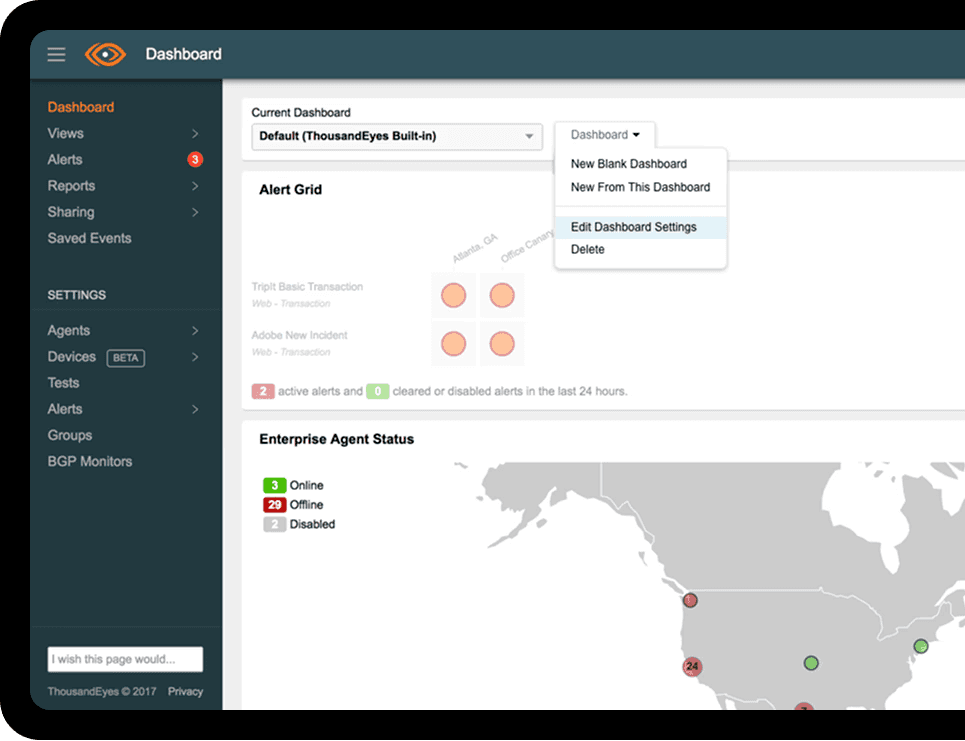
When I joined as the sole designer, the company relied on one product offering: Cloud & Enterprise Agents. During my tenure it scaled into a multi-product suite. Each new product brought its own customer segmentation, deployment constraints, data visualization expectations and pricing model.

FLAGSHIP
Cloud & Enterprise Agents
Active probes simulating traffic from different locations to critical servers.
NEW
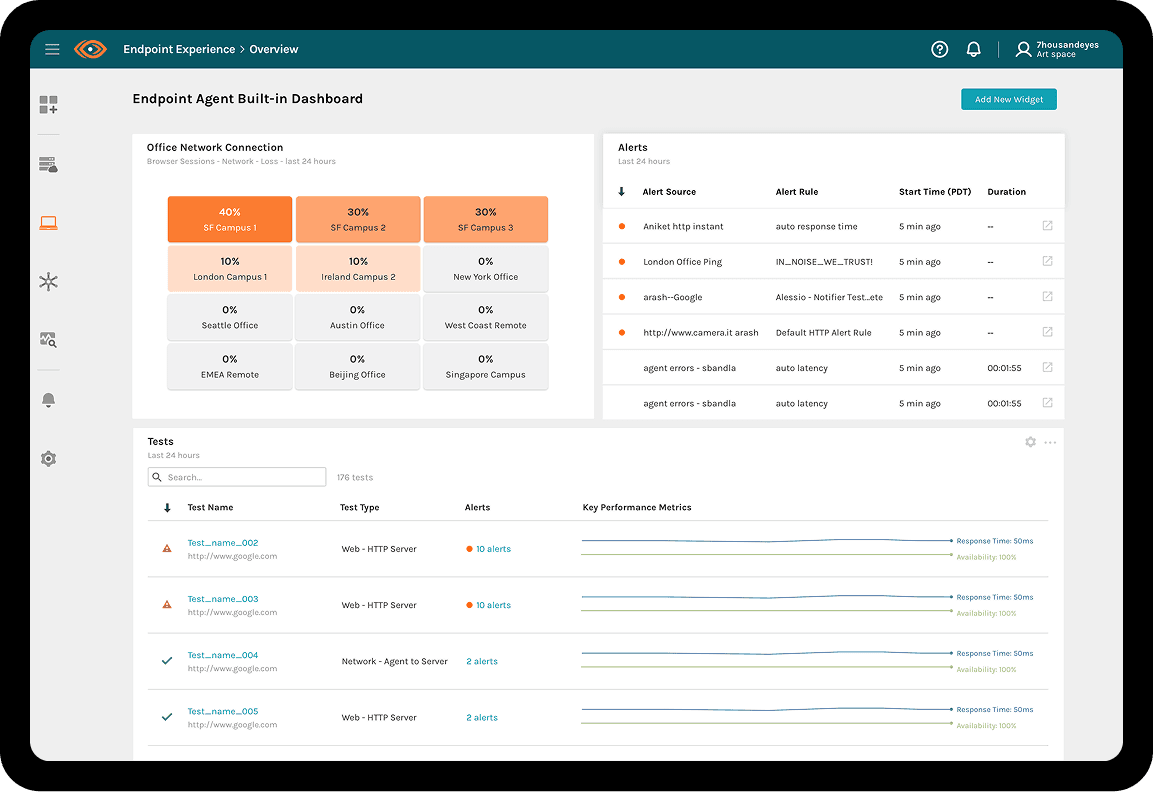
Endpoint Agents
Installed on employee laptops to monitor network quality for branch officesand and remote workers.
NEW
Device Layer
Automated discovery and visualization of local-network infrastructure like switches and routers.
NEW
Internet Insights
Aggregated view based on all ThousandEyes's customers data to visualize significant internet outages in real time.
Before: the original beta didn’t hold up at large data scale.
THE STARTING POINT
Each new product broke something which the platform took for granted.
Data at a new scale. Endpoint Agents monitored tens of thousands of laptops. Plotting millions of fragmented data points created an unreadable “spaghetti monster.”
Deployment varied wildly. Cold configuration pages on Day 0 led to heavy trial drop-off.
Mismatched pricing. Usage-based billing next to license subscriptions. Enterprise buyers couldn’t see total cost of ownership.
02 · CORE TRADEOFF
Products can go deep in different directions and still share one architecture.
The question was double-edged: how do we honor the deep technical needs of each specialized product line while keeping the platform consistent and intuitive? My answer was a unified Platform UX Architecture that bridged the products.
Each product line
Cohesive diversity
Every product keeps the visualization, setup and pricing model its users need. A help desk tech and a network engineer don’t get the same screen.
All product lines
Seamless consistency
Shared patterns for how data is revealed, how setup is guided and how cost is shown, so moving between products feels like one tool.
03 DESIGN GOALS
Three goals shape the whole journey
GOAL A - DATA VISUALIZATION
Show the alert first. Reveal the network only when asked.
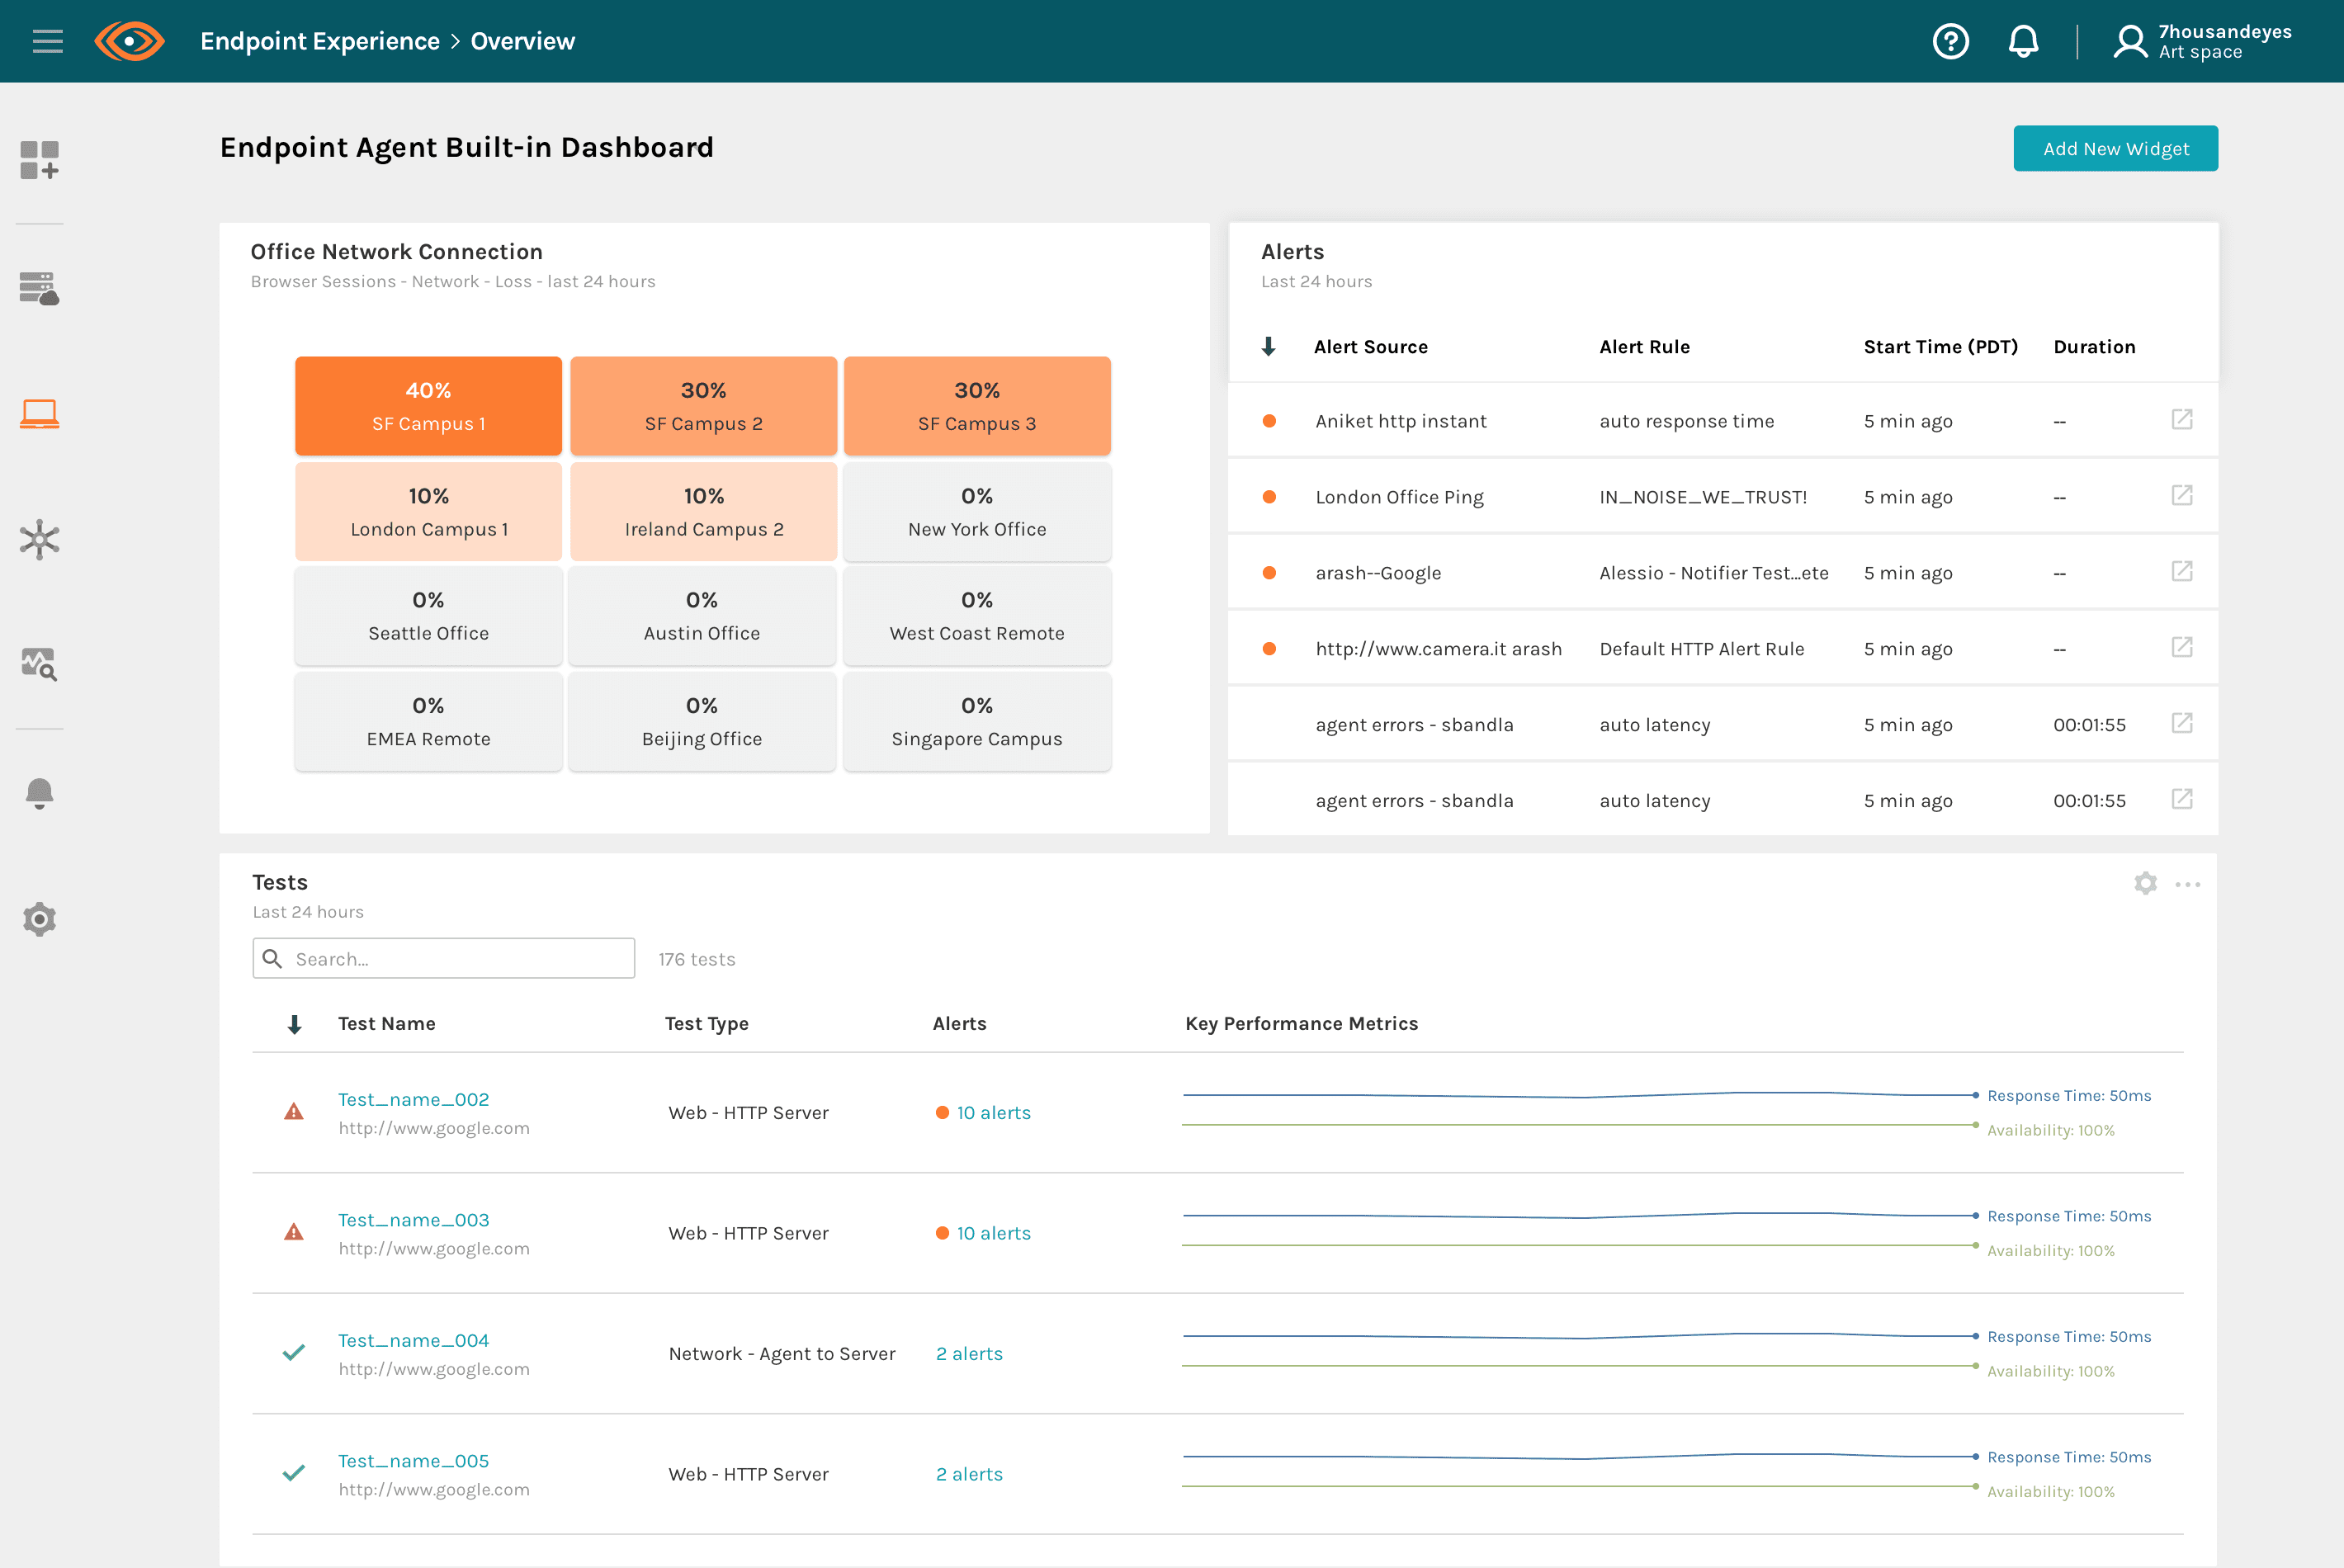
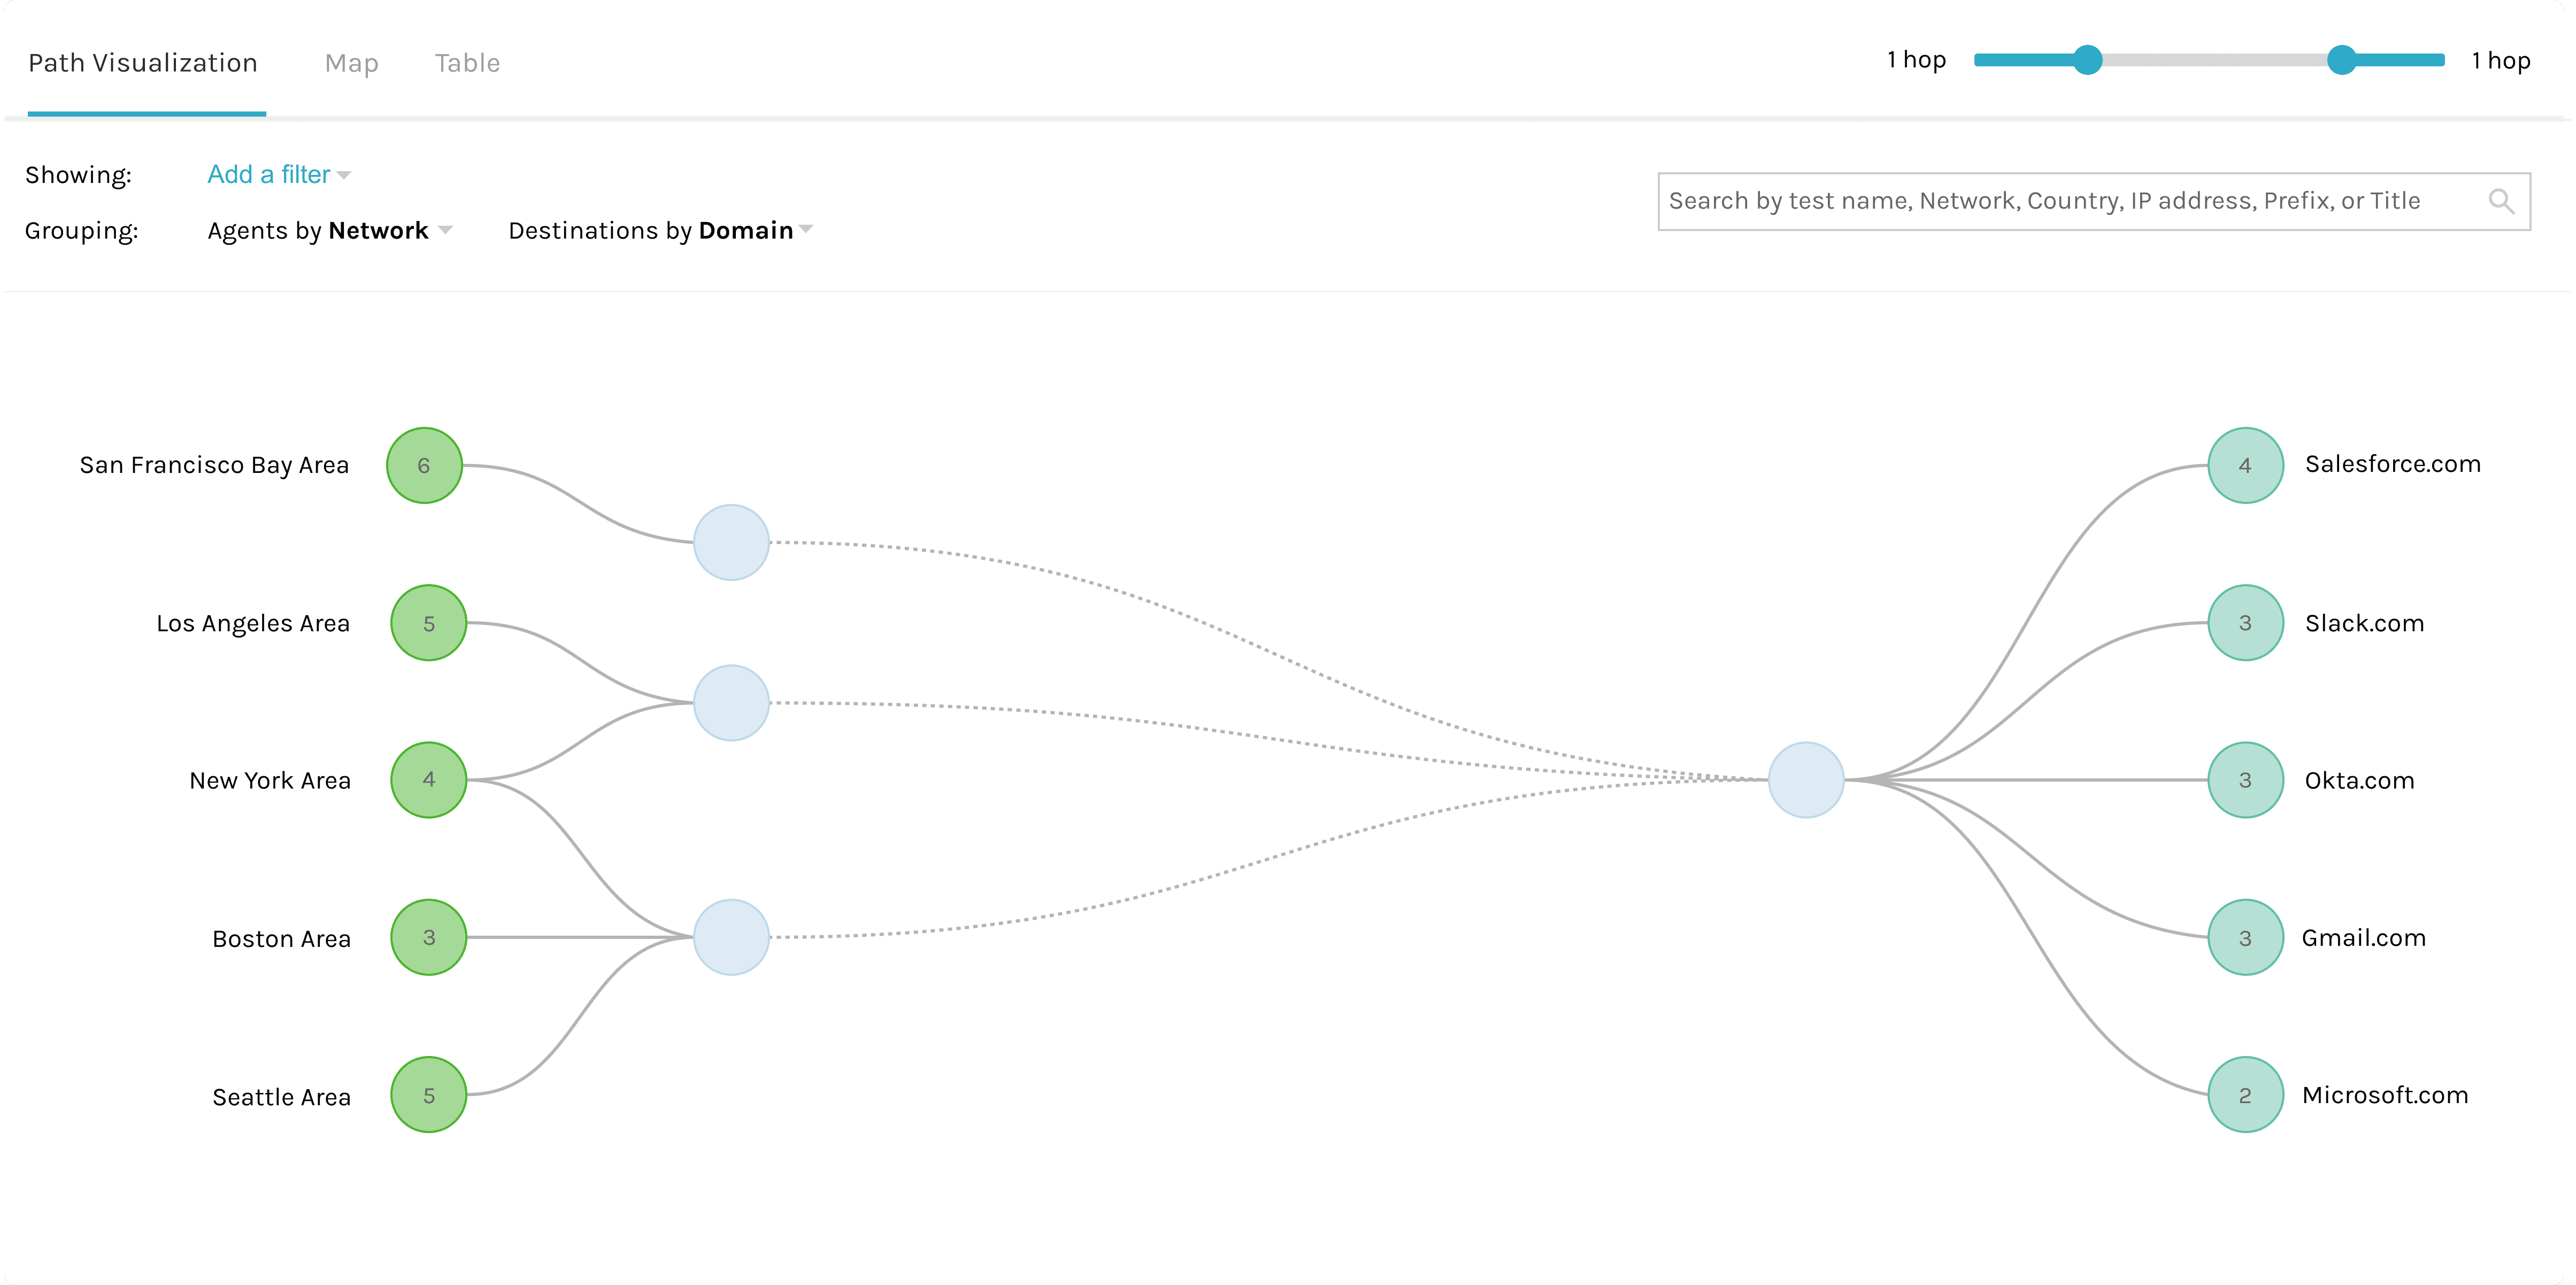
Endpoint Agents generated millions of fragmented points, which plotted directly became unreadable. I set up a 3-step framework based on progressive disclosure to manage the cognitive load.
STEP 1
Summary overview
The first fold shows high-level system health and actionable insights based on alerts.
STEP 2
Concentrated alerts
Anomalies are highlighted and clustered. Deep technical detail stays hidden to keep users away from noise.
STEP 3
Diagnostic node grouping
On deep-dive, data streams cluster into logical node groups. Zoom and drag to pinpoint the failing router or terminal.
GOAL B - DAY 0 ONBOARDING
Show the value before deployment.
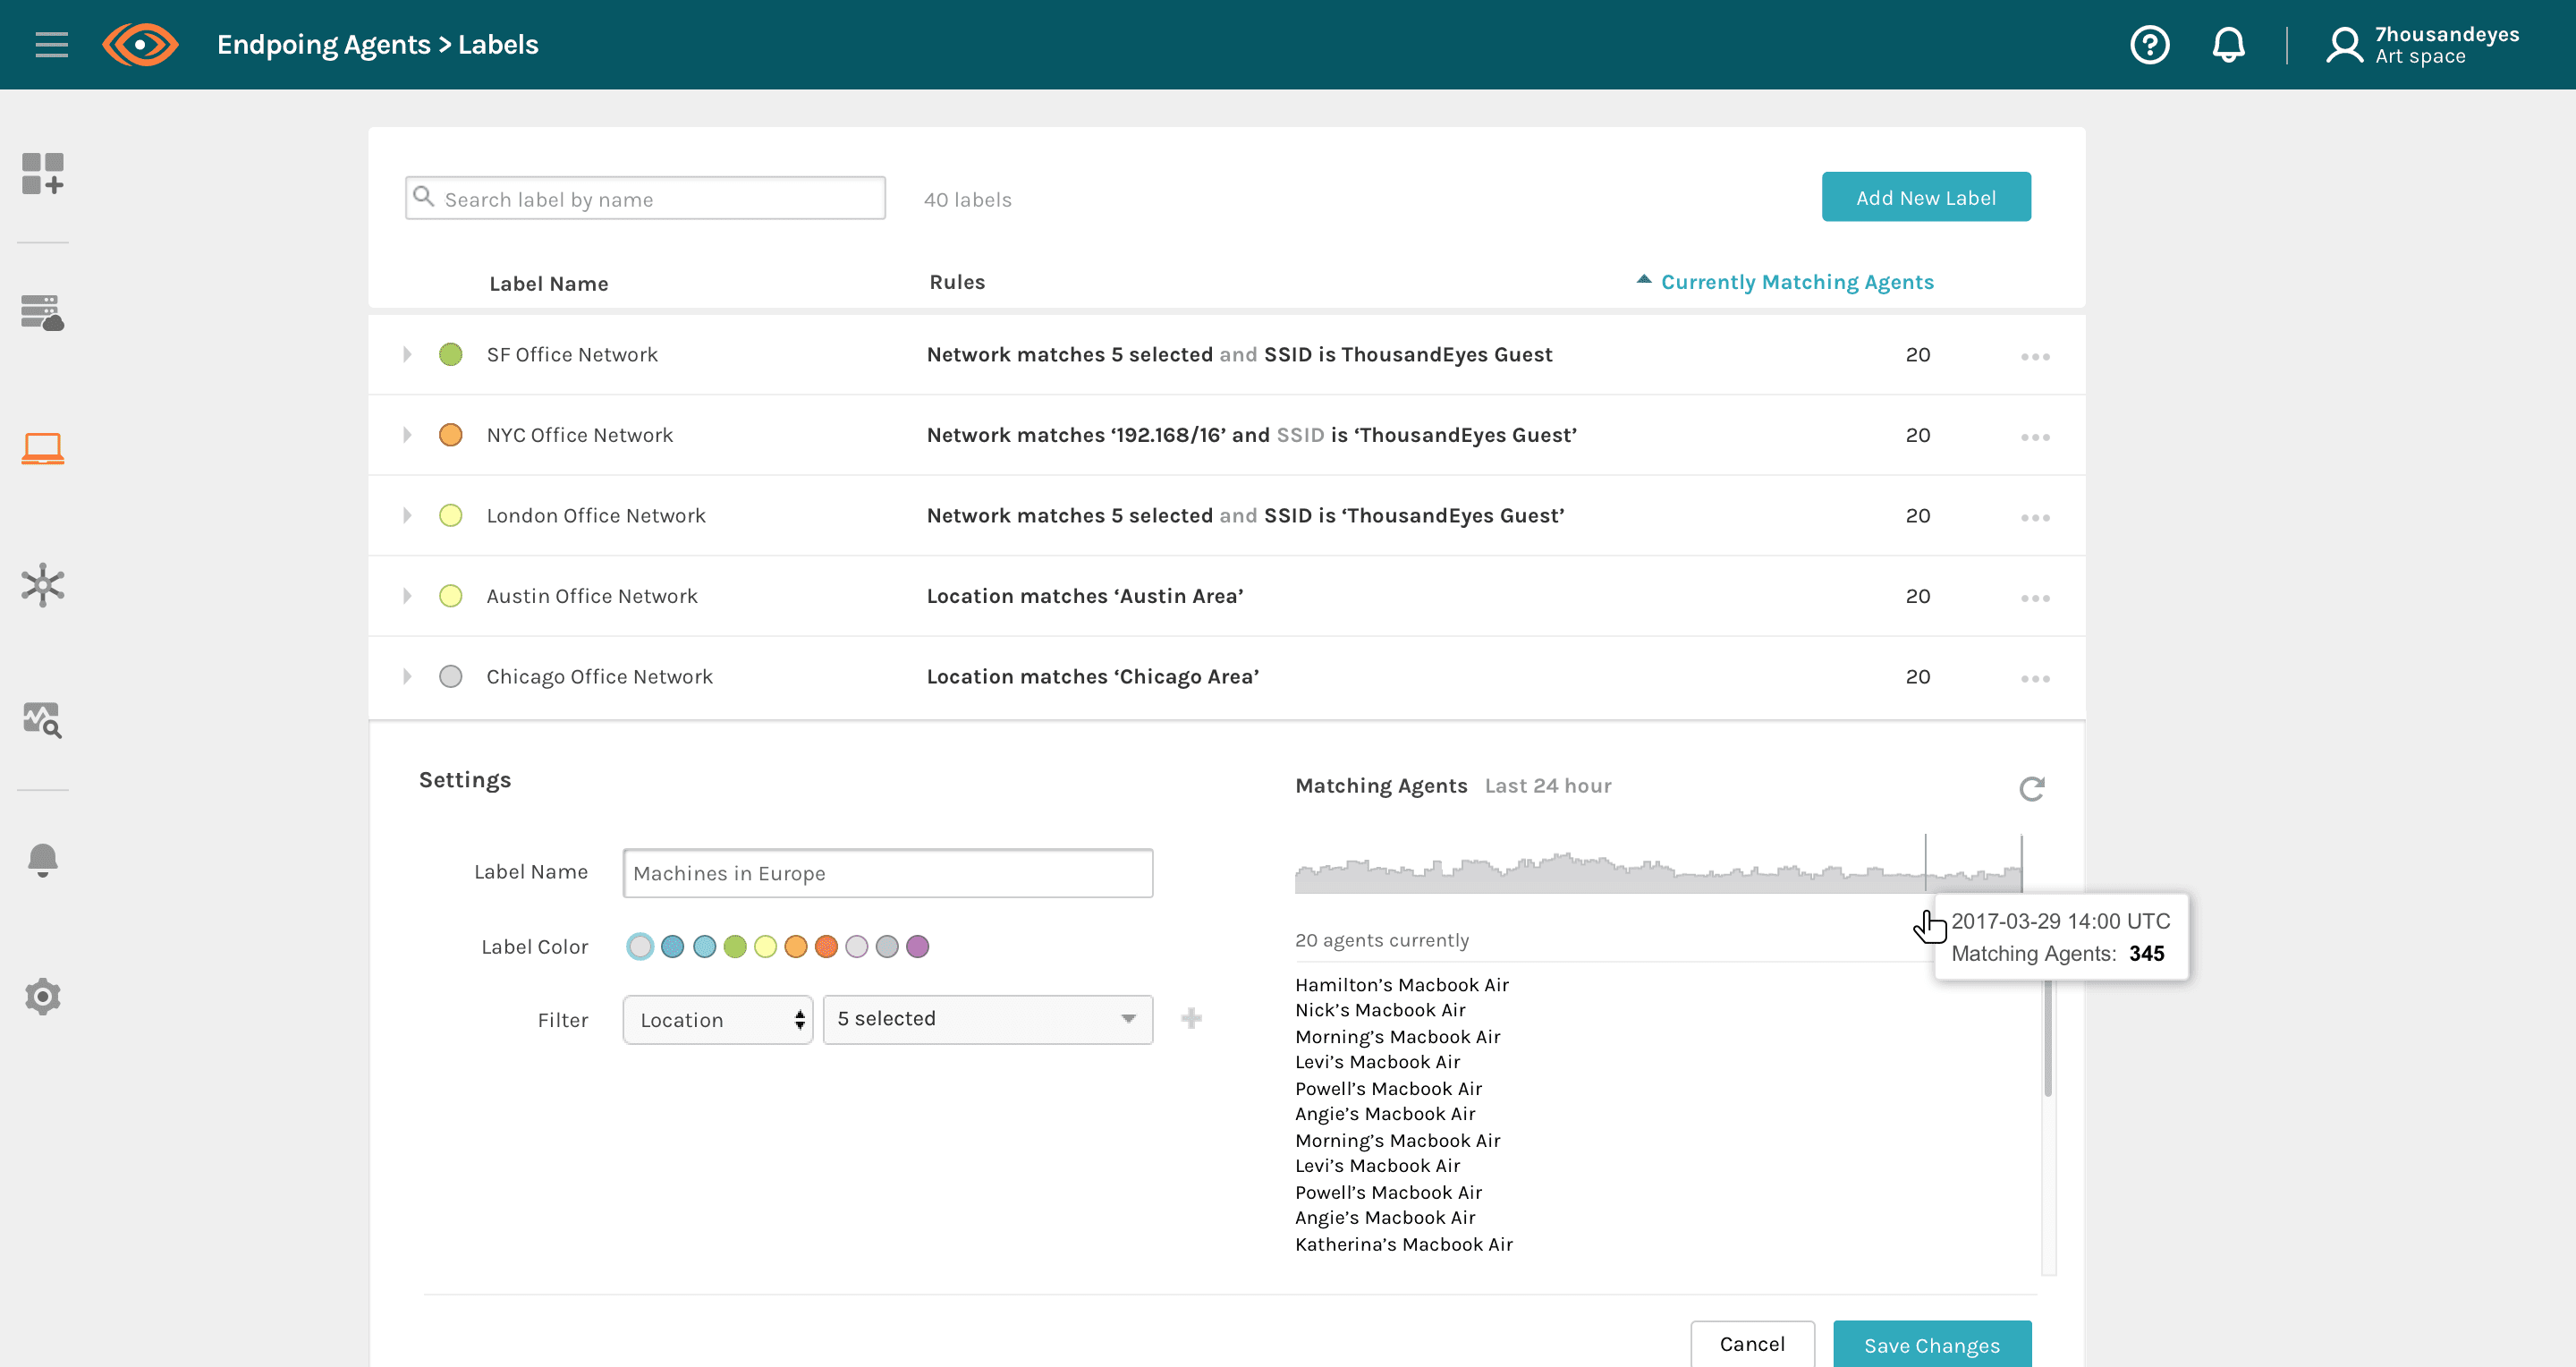
Endpoint Agents needed IT admins to installed agent applications to thousands of laptops. Device Layer needed complex enterprise agents setup. Cold configuration pages on Day 0 drove trial drop-off, so I designed a “value-first, guided setup” day 0 experience.

Endpoint Agent Day 0 Experience

Devices Day 0 Experience
FIRST
Illustrations & sample data
Each new product opens with scenario-specific illustrations and interactive sample data tailored to the role (network engineer or help desk), so users see their finished dashboard before any config.
THEN
Deployment wizard
One step-by-step wizard for every product. The UI wraps all complexities in the same progress indicators, real-time feedback and error validation.
GOAL C - BILLING & QUOTING
Unified usage-based pricing model
Going from one product to four brought usage-based billing alongside license subscriptions. I redesigned the Organizational Overview and created a dynamic quoting experience that turns usage calculations into an interactive experience where buyers can predict costs and manage budgets across all product lines.
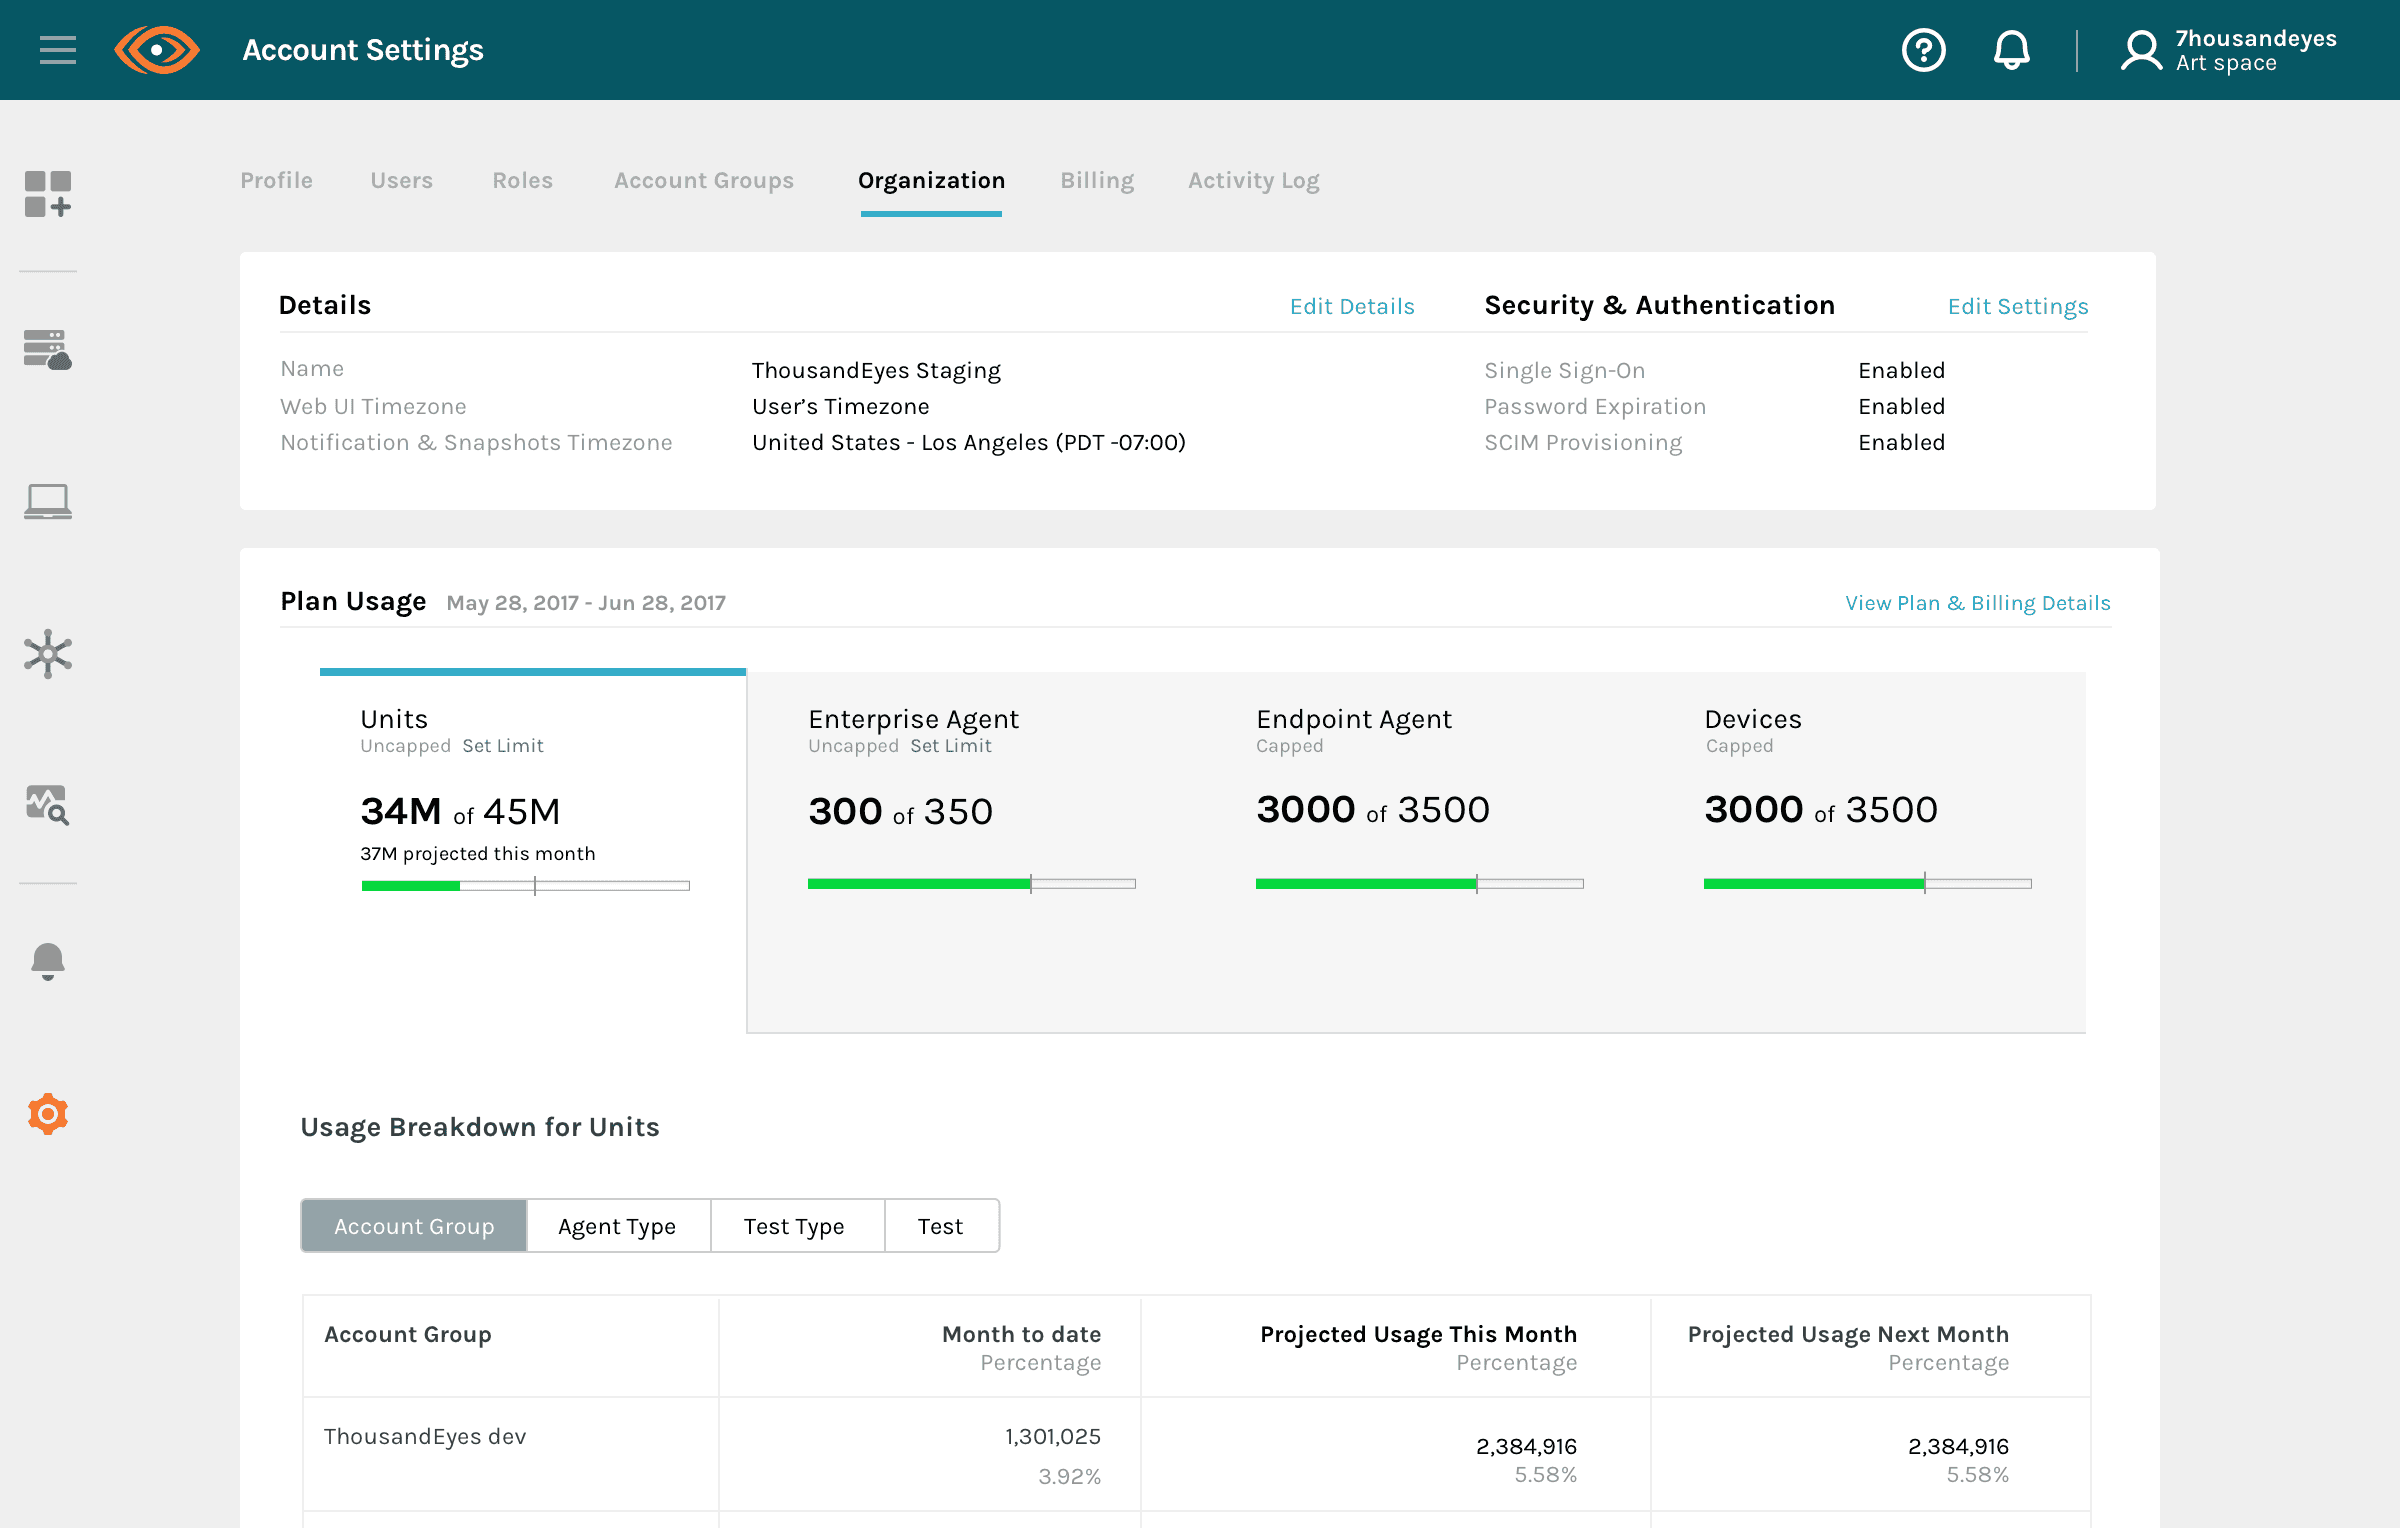
Organizational Overview
Usage and quota for every product in one view.

Quoting Tool
Buyers model cost before they commit.
04 - REUSABLE FRAMEWORKS
Three interaction frameworks, reused across every product line.
01
Progressive disclosure from alerts to diagnosis
Kept the first screen legible at any data scale, and gave every monitoring product the same path from overview to root cause, so users learned it once.
02
Value-first onboarding and unified deployment wizard
Replaced cold configuration pages with sample data and one guided setup pattern, addressing trial drop-off however complex the underlying install.
03
Unified billing and quoting
Brought usage-based pricing as one pane of glass, so enterprise buyers could predict total cost across the platform before purchase decision.
05 - OUTCOMES
The platform expanded and the experience held up.
GARTNER CUSTOMER EXPERIENCE
4.73/5
Across 48 company reviews, sustained through a complete product evolution.
COMPANY VALUATION
20×
Valuation grew rapidly and ended in acquisition by Cisco (~$1B).
DESIGN FUNCTION
UI → Product Design
From a solo designer to leading the product design team.
06 - REFLECTION
Differentiate, then make it familiar.
Start from each product’s scenario and persona
A network engineer tracing a path, an IT admin rolling out agents to thousands of laptops and a help desk tech checking one user’s Wi-Fi need different things. I designed each product around its own data scale, deployment reality and job to be done before looking for overlap.
Then find the interactions they share
Once the differences were clear, the common ground showed up in behavior: every product moves from overview to alert to diagnosis, every setup is a guided sequence, and every plan resolves to quota and cost.
Consistent interactions lower the cost of the next product
Keeping those interaction models the same meant a customer who learned one product already knew how to read, set up and budget for the next one.